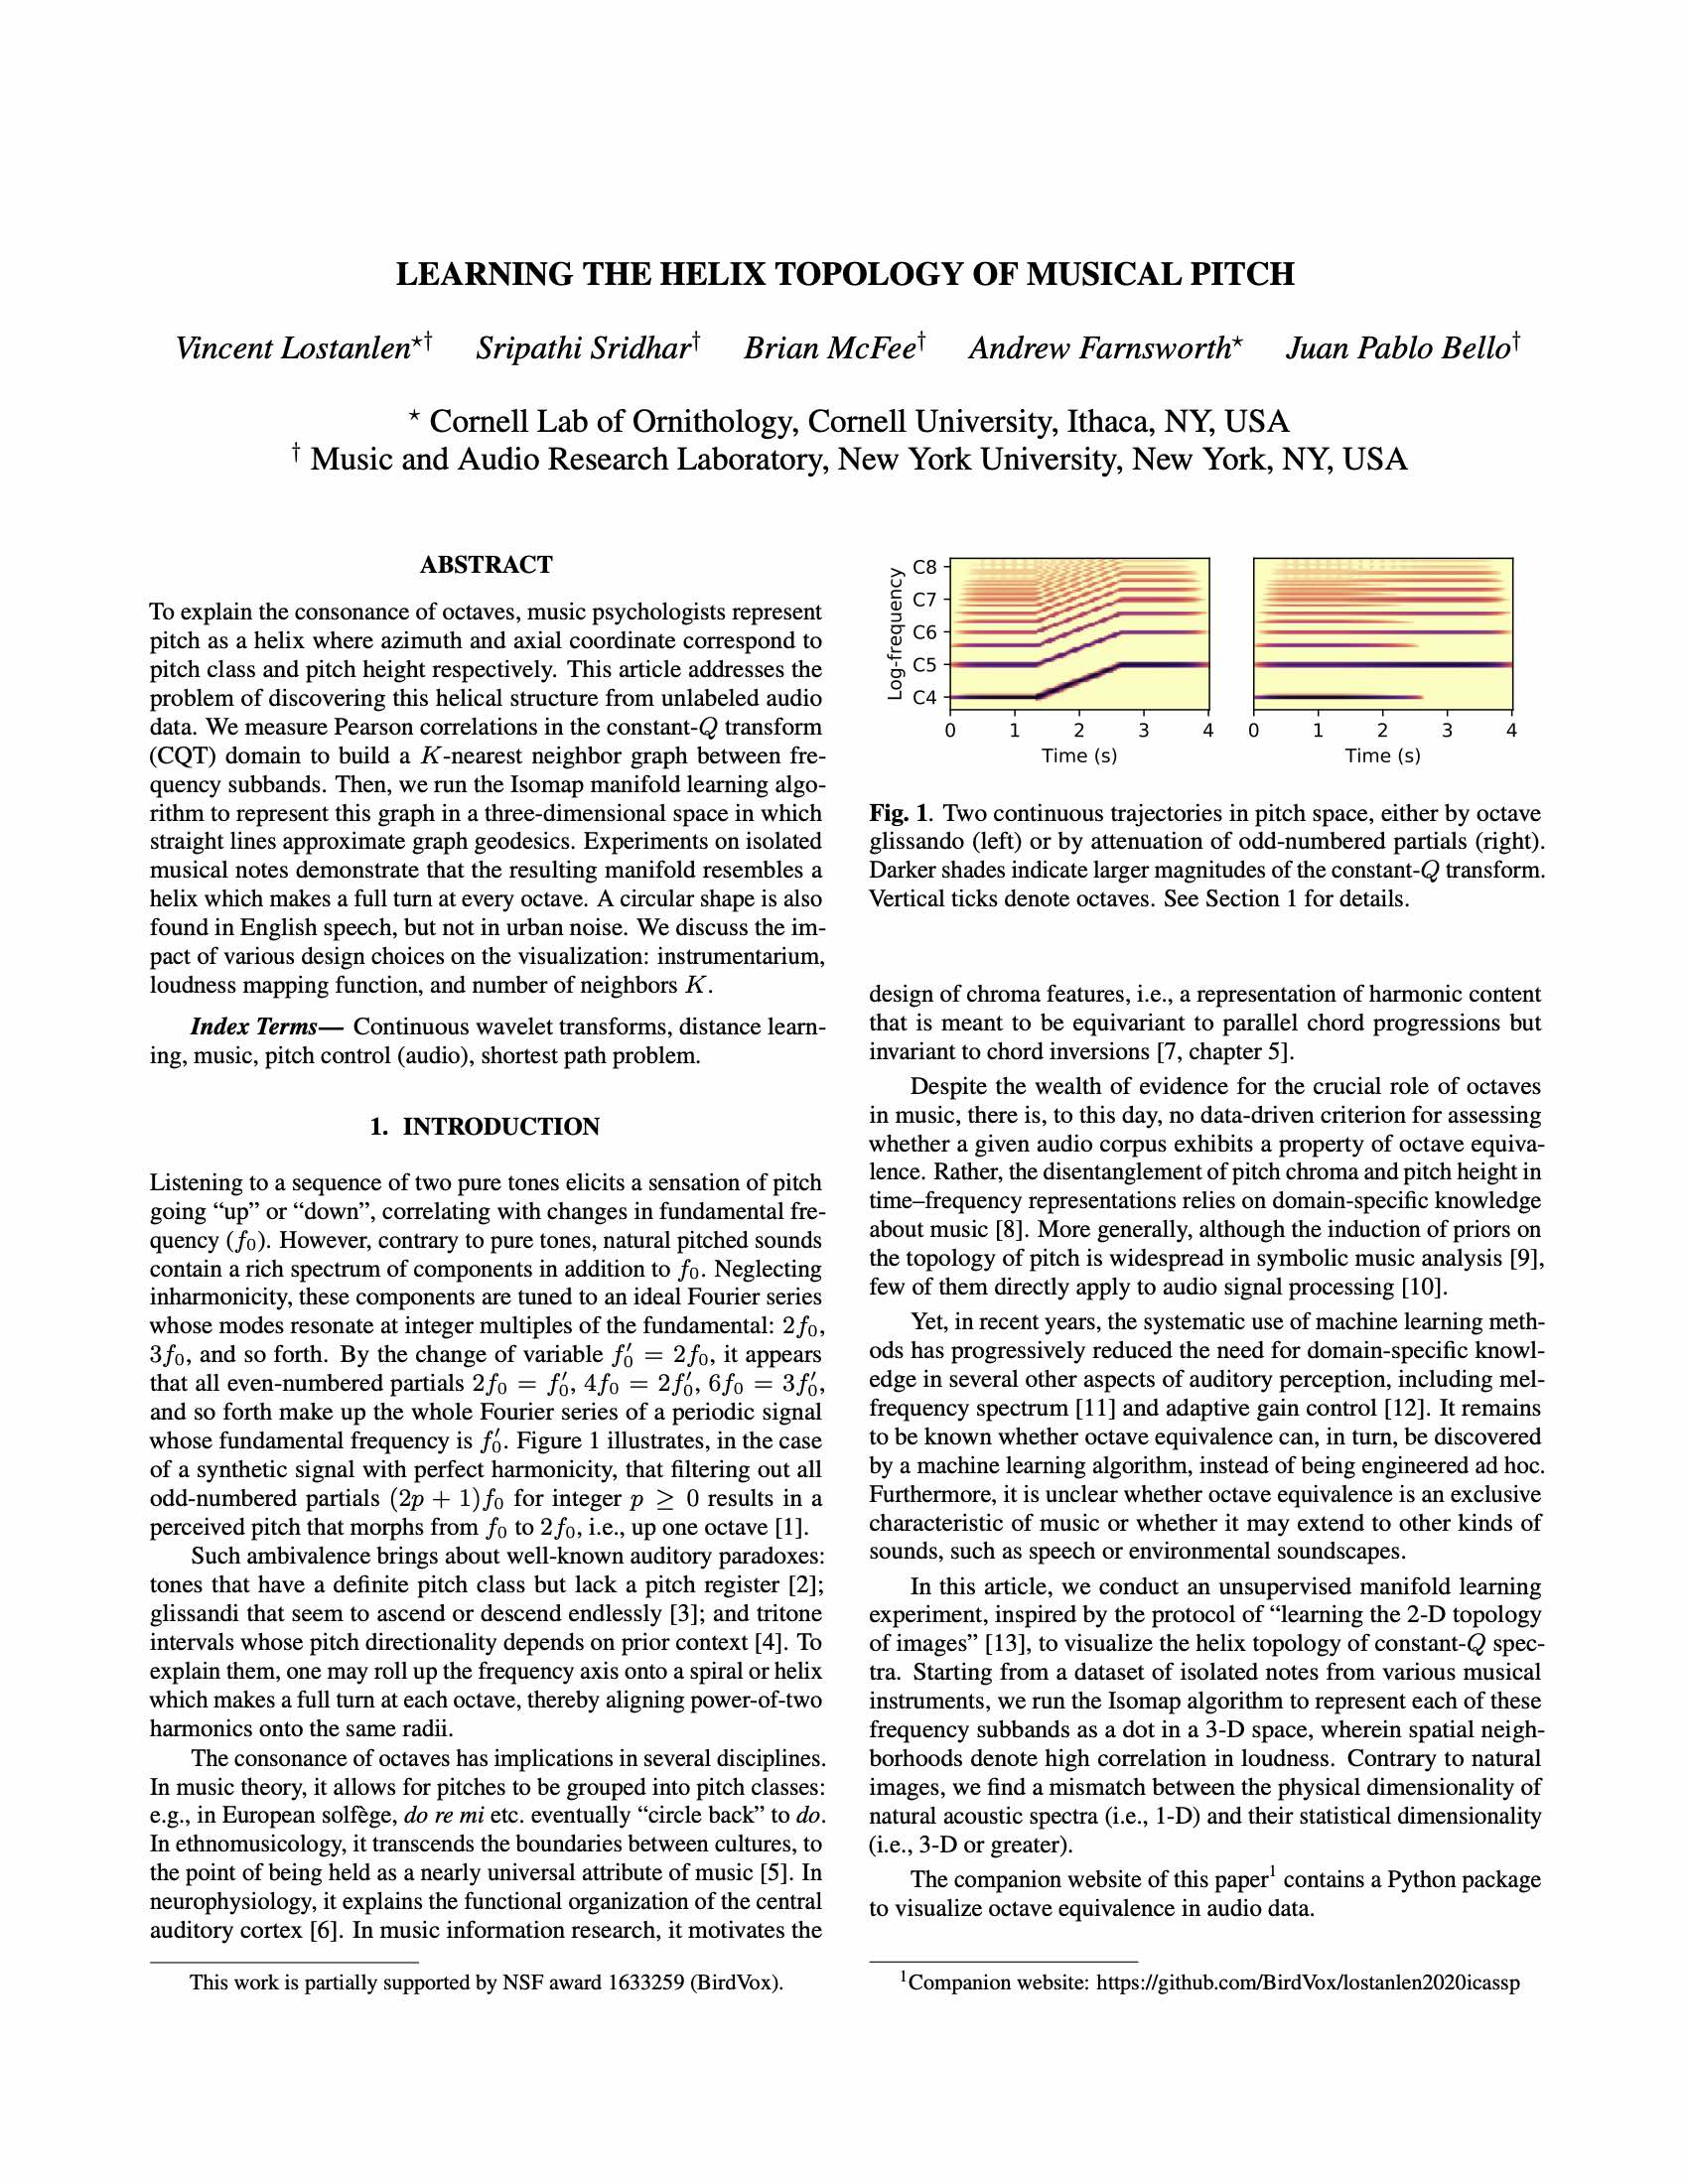
Learning the Helix Topology of Musical Pitch
To explain the consonance of octaves, music psychologists represent pitch as a helix where azimuth and axial coordinate correspond to pitch class and pitch height respectively. This article addresses the problem of discovering this helical structure from unlabeled audio data. We measure Pearson correlations in the constant-Q transform (CQT) domain to build a K-nearest neighbor graph between frequency subbands. Then, we run the Isomap manifold learning algorithm to represent this graph in a three-dimensional space in which straight lines approximate graph geodesics. Experiments on isolated musical notes demonstrate that the resulting manifold resembles a helix which makes a full turn at every octave. A circular shape is also found in English speech, but not in urban noise. We discuss the impact of various design choices on the visualization: instrumentarium, loudness mapping function, and number of neighbors K.

